.svg)

What is a crypto sentiment dashboard - and why does it matter for your investments?
Learn how a crypto sentiment dashboard turns complex market data into clear trading signals. See how Diamond Pigs is bringing this tool to retail investors.
.png)
What is a crypto sentiment dashboard - and why does it matter for your investments?
Understanding the crypto market used to require hours of research, multiple tools, and a high tolerance for noise. A crypto sentiment dashboard changes that. It pulls together the signals that actually drive Bitcoin's price - on-chain data, funding rates, macro trends, and market mood - and presents them in one clear daily view. For retail investors, this kind of structured insight has historically been out of reach. That is starting to change.
Why does market sentiment matter in crypto?
Market sentiment is the collective mood of investors at any given moment. In crypto, that mood moves fast - and it moves prices. Fear causes sell-offs. Greed drives rallies. Understanding where sentiment sits today helps investors avoid two of the most common and costly mistakes: buying at the top out of excitement, or selling at the bottom out of panic.
Sentiment is not a replacement for strategy. It is context. Knowing whether the market is fearful or greedy does not tell you exactly what to do. However, it tells you what kind of environment you are investing in - and that shapes how you should interpret price movements.
Traditional financial markets have long relied on sentiment indicators: put/call ratios, fund flows, consumer confidence indexes. Crypto has its own equivalents, and they are increasingly sophisticated. The challenge has been making them accessible to everyday investors without a background in data analysis.
What signals does a crypto sentiment dashboard track?
A well-designed crypto sentiment dashboard does not show you one number. Instead, it combines several data streams, each measuring a different aspect of market behaviour. Together, they give a more complete picture than any single indicator could.
Price and momentum data covers where Bitcoin is trading, how that compares to recent ranges, and whether price is trending up or down on meaningful volume. A rising price on declining volume signals upward pressure without broad conviction - many investors are watching rather than committing capital.
On-chain data tracks what is actually happening on the Bitcoin blockchain. Are large wallets accumulating or distributing coins? Are coins moving from long-term holders to exchanges, which often signals upcoming selling? Platforms like Glassnode and CryptoQuant specialise in this kind of analysis. On-chain data reflects real behaviour, not just opinion.
Funding rates show whether traders in crypto derivatives markets are positioned long (expecting prices to rise) or short (expecting prices to fall). Extremely high positive funding rates often signal overcrowded long positions, which can lead to sharp corrections when those positions unwind.
Macro context matters because crypto does not move in isolation. Interest rates, dollar strength, equity market direction, and global liquidity all influence Bitcoin. A rising VIX (a measure of fear in equity markets) frequently correlates with crypto weakness.
The relationship between Bitcoin and the Nasdaq has become more important in recent years, as higher interest rates compress both tech stocks and digital assets at the same time.
Fear and greed composite score aggregates several inputs to place current market sentiment on a spectrum from extreme fear to extreme greed. According to Alternative.me, which publishes one of the most widely used versions of this index, extreme fear has historically corresponded with buying opportunities, while extreme greed has preceded corrections.
What does each module on the Diamond Pigs sentiment dashboard show?
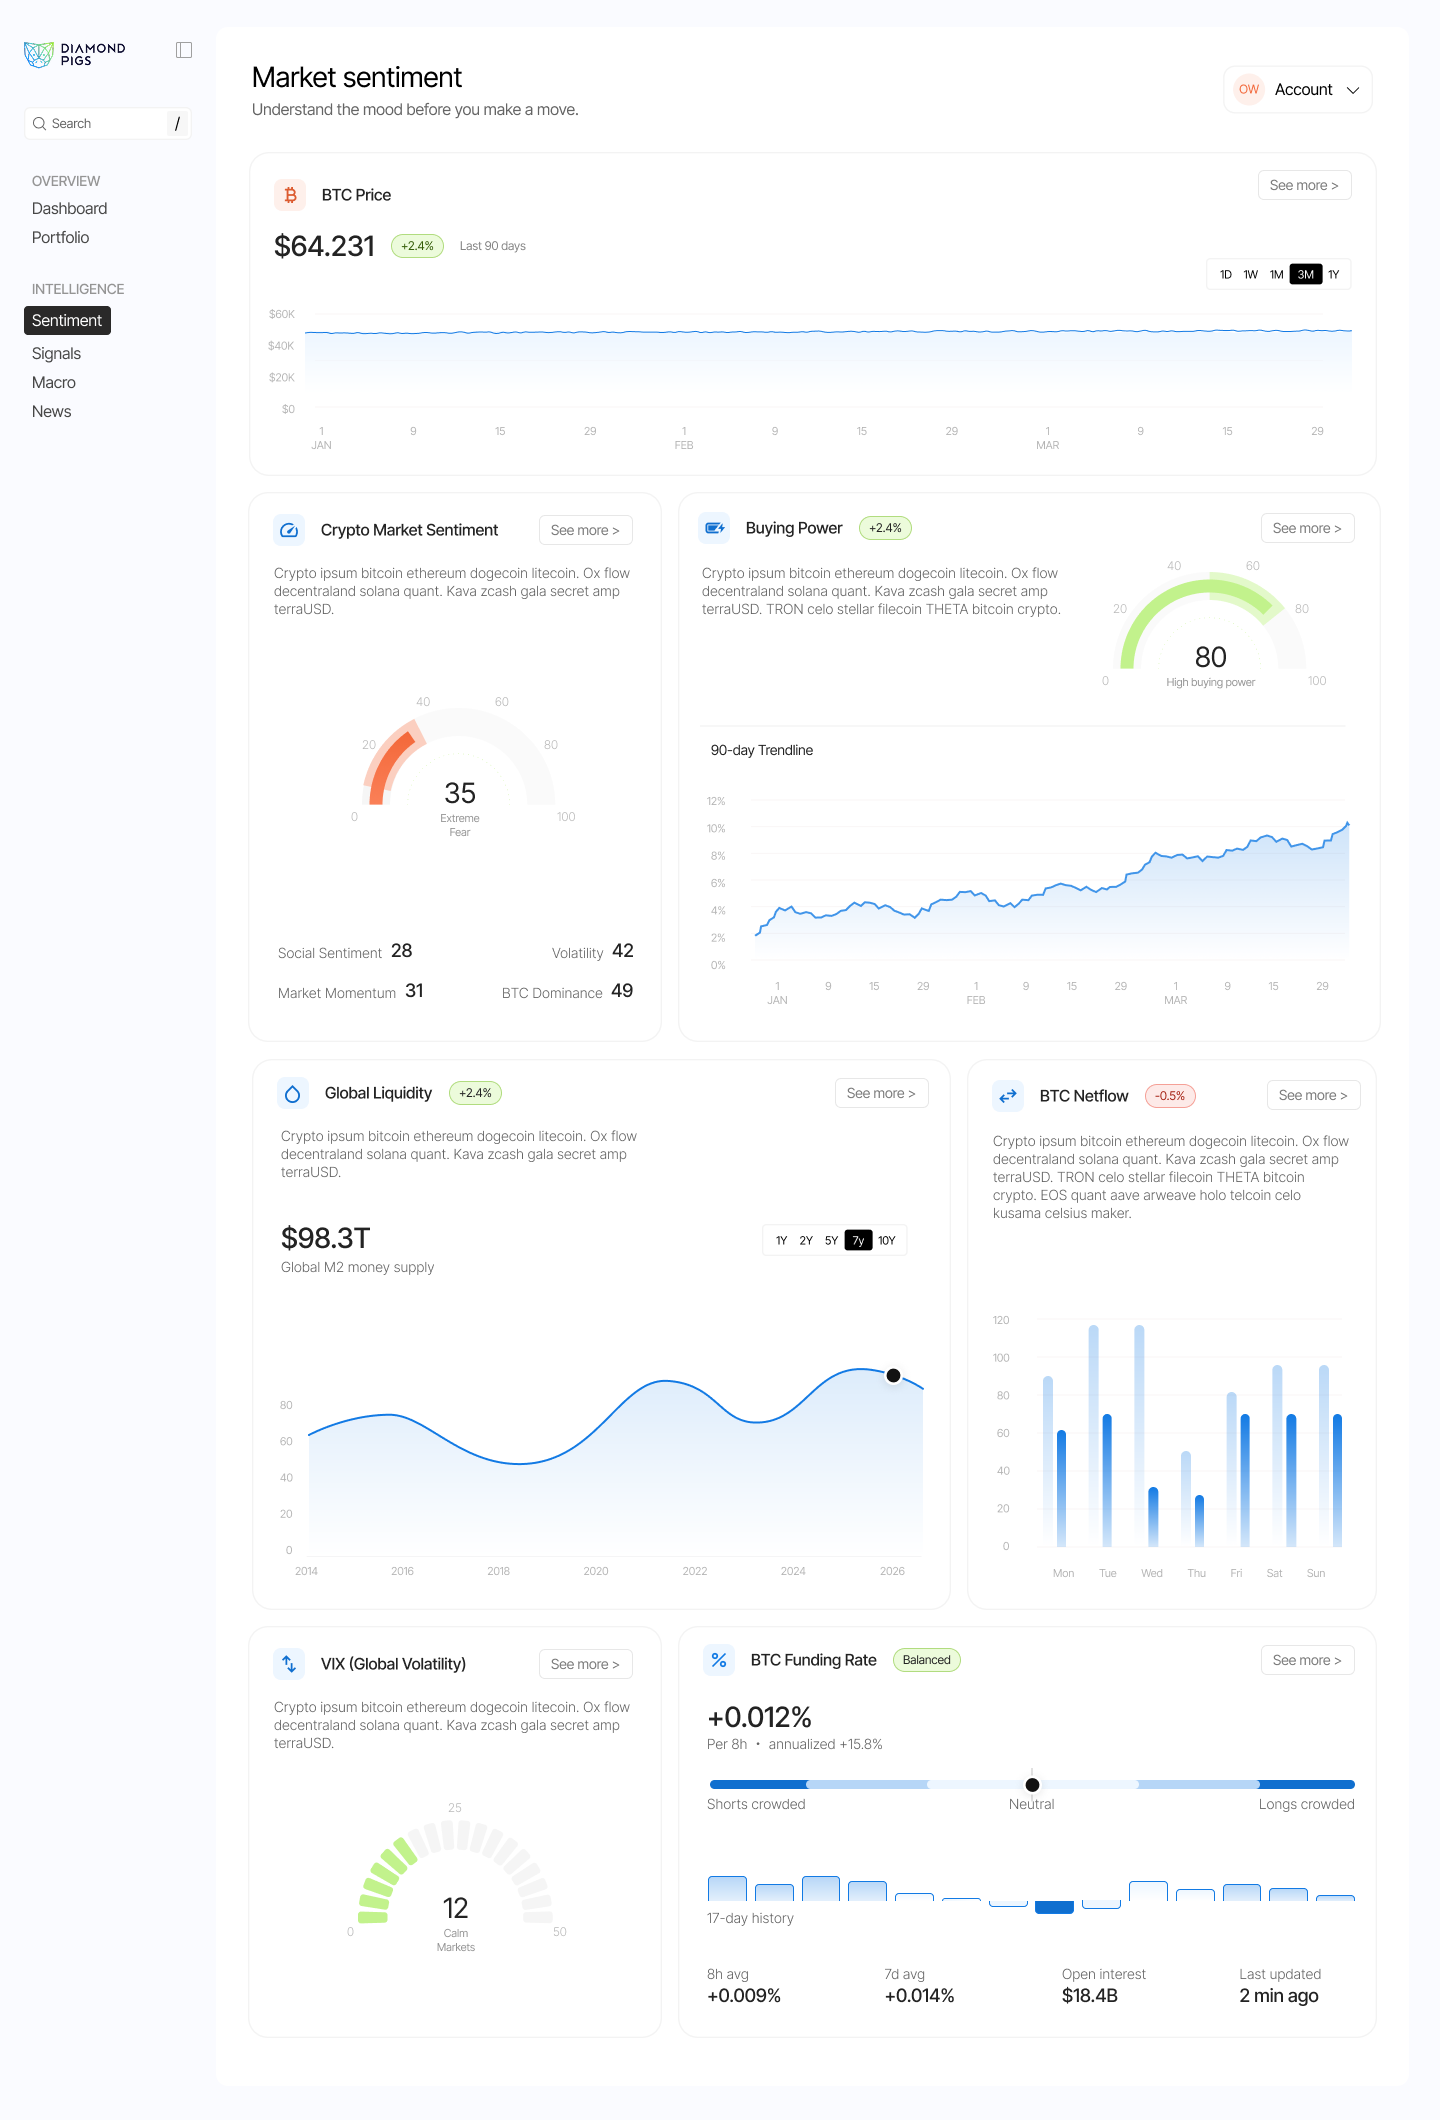
Diamond Pigs is launching its own Crypto Sentiment Dashboard. The dashboard translates complex market data into a set of clear, labelled modules - each covering a specific dimension of market health. Here is what each one tracks and why it matters.
Sign up for an early access here: https://www.diamondpigs.com/crypto-sentiment-dashboard
The dashboard opens with a daily summary signal. All modules displayed on the dashboard are explained below:
BTC Price tracks the current Bitcoin price and its trend across five timeframes: 1 day, 1 week, 1 month, 3 months, and 12 months. The timeframe selector allows investors to shift between short-term context and longer-term perspective. Understanding price in relation to recent range and volume - not just the number itself - is what makes this signal useful.
Buying Power measures stablecoin supply as a share of total crypto market cap. When this ratio rises, more capital is sitting in stablecoins on the sidelines, ready to be deployed into crypto. A high buying power reading is a positive signal, as it suggests there is fuel available for the next move. The dashboard currently shows stablecoin supply at 10.86% of total crypto market cap, up 7.1% recently.
BTC Netflow measures the net movement of Bitcoin between exchanges and private wallets. When outflows exceed inflows - meaning more Bitcoin is leaving exchanges than arriving - investors are moving coins into long-term storage rather than preparing to sell. This is called accumulation. When inflows dominate, it can signal that investors are preparing to sell. The dashboard displays this as a weekly bar chart of inflows vs. outflows, making the recent direction immediately clear.
BTC Funding Rate shows the cost of holding a leveraged position in Bitcoin futures markets. A positive rate means long traders pay short traders, signalling bullish market lean. A very high positive rate often points to overcrowded long positioning - a potential setup for a sharp correction. The dashboard shows the current 8-hour rate, the annualised equivalent, and total open interest, and places the reading on a visual gauge from "shorts crowded" to "longs crowded". At time of writing, the rate is +1% per 8 hours (annualised +5.8%), with $18.4 billion in open interest - a balanced reading.
Global Liquidity tracks the total global M2 money supply, currently at $96.77 trillion. Bitcoin has a historically strong correlation with global liquidity: when central banks expand money supply, more capital flows into risk assets including crypto. Watching the direction of global M2 - not just the Bitcoin price - helps investors understand the macro current their portfolio is moving with.
Crypto Market Sentiment is a composite score drawing on four sub-signals: social sentiment, volatility, market momentum, and Bitcoin dominance. Together, these produce a reading on a gauge from extreme fear to extreme greed. A greed reading suggests the market may be getting ahead of itself. A fear reading often corresponds with undervalued conditions and accumulation opportunities. You can track this live via CoinMarketCap's Fear and Greed Index.
VIX (Global Volatility) shows the CBOE Volatility Index, a widely used measure of expected volatility in US equity markets. A calm VIX supports risk assets like crypto. A spiking VIX signals fear in broader markets - and historically, crypto has weakened alongside equity stress. A "calm markets" VIX reading, as the dashboard currently shows, is a supportive backdrop for crypto positioning.
Data-driven investing means acting on market signals, not emotions.

How do crypto trading signals work?
A crypto trading signal is a data-driven indicator that suggests whether market conditions favour entering, holding, or reducing a position. Signals can come from technical analysis, on-chain data, derivatives positioning, or a combination of all three.
Most retail investors encounter signals in their simplest form: buy and sell alerts based on moving averages or RSI readings. These have value, but they also have limits. When thousands of traders use the same indicators, the edge they provide reduces - because everyone reacts at the same time and the same price levels become self-defeating.
More reliable signal systems combine multiple data streams and look for alignment across them. A long signal that appears in price momentum, is confirmed by on-chain accumulation, and is supported by macro conditions carries far more weight than one based on a single chart pattern.
The direction of crypto trading is also increasingly automated. According to Grand View Research the automated crypto trading market was valued at $22.23 billion in 2025 and is growing rapidly. Research suggests that 50 to 60 percent of crypto trading volume is already driven by algorithms, with broader financial markets running even higher. This creates compressed volatility - sharper and faster price moves with less time to react. A dashboard that gives you clear, aligned signals at a glance becomes more valuable in that environment, not less.
How should you use sentiment data in your investment decisions?
Sentiment data is most useful as a filter, not a trigger. It helps you avoid acting on emotion by replacing gut feel with structured information. Here is a practical way to think about it across different market phases.
In periods of extreme fear, sentiment dashboards often show on-chain accumulation by long-term holders even as prices fall. Fear on the surface, accumulation underneath - this combination has historically marked the later stages of bear markets. It does not mean the bottom is in, but it does suggest that risk is reducing.
In periods of extreme greed, funding rates are typically elevated, speculative activity rises, and retail inflows spike. This combination has often preceded corrections. It is a signal to review your exposure and consider whether you are comfortable with your current risk level.
In transition phases - where the market is stabilising but not yet trending clearly - the most useful signal is often what is not happening. If Bitcoin's price is rising but volume is weak, conviction is low. If sentiment is cautiously optimistic but on-chain accumulation remains strong, the market may be building toward a new leg higher. Diamond Pigs described exactly this environment in its April 2026 update: "stabilization without conviction" - a market that rewards patience over reaction.
The four-pillar crypto investment framework developed by Diamond Pigs places market regime reading as the first pillar, because understanding the broader context shapes everything else: which strategy to use, when to build positions, and when to reduce exposure. You can read more about that framework in The end of the Crypto Cowboy Era. Sentiment data is a core input into that regime reading, and the Diamond Pigs dashboard is built to make it accessible.
You can also explore how Diamond Pigs uses AI-driven market analysis day-to-day in Inside Diamond Pigs: How we power smarter crypto investing.

Can sentiment signals replace a trading strategy?
No. Sentiment signals improve decision-making within a strategy, but they do not replace one. A strategy defines your rules: which assets to hold, how much to allocate, under what conditions to reduce exposure, and over what time horizon. Sentiment data informs how you apply those rules given current conditions.
This distinction matters because acting on sentiment alone - without a strategy - is just a more data-rich version of emotional trading. You see a fear signal and sell. You see a greed signal and buy. The data is better, but the behaviour is the same.
Effective use of sentiment data requires pairing it with a clear investment framework. For long-term investors, that might mean using sentiment signals to time additional contributions during fearful markets, or to rebalance toward safer positions during periods of extreme greed. For automated strategies like those on Diamond Pigs, sentiment signals feed into the broader market regime analysis that determines which bots are active and how aggressively they position.
If you are not sure which strategy fits your situation, Diamond Pigs offers a free Strategy Matching Tool that asks six questions and recommends the most suitable approach based on your goals, risk tolerance, and wallet size. You can also explore the full range of investment strategies on the platform.
Key takeaways
- A crypto sentiment dashboard combines multiple data streams - on-chain data, funding rates, macro context, and fear/greed indicators - into a single structured daily view of market conditions.
- The Diamond Pigs Sentiment Dashboard has seven modules: BTC Price, Buying Power, BTC Netflow, BTC Funding Rate, Global Liquidity, Crypto Market Sentiment, and VIX. Each measures a distinct dimension of market health.
- Sentiment is context, not a trigger. It tells you what kind of environment you are investing in, which shapes how you interpret price movements and make decisions.
- Trading signals are most reliable when they align across multiple data sources. Price momentum, on-chain accumulation, and supportive macro conditions pointing in the same direction carry far more weight than any single indicator.
- Diamond Pigs is launching its Crypto Sentiment Dashboard to give retail investors institutional-grade market signals in a simple, jargon-free daily format. Early access is free.
- Sentiment data works best when paired with a clear investment strategy. Without structure, even good data leads to reactive decisions.

Frequently asked questions
What is a crypto sentiment dashboard?
A crypto sentiment dashboard is a tool that aggregates multiple market signals - including on-chain data, derivatives positioning, macro indicators, and fear/greed metrics - into a single daily view. Rather than monitoring each source separately, investors can see the overall market mood and the key drivers behind it at a glance. The goal is to make complex market information accessible and actionable for everyday investors.
What does BTC Netflow mean?
BTC Netflow measures the net movement of Bitcoin between exchanges and private wallets over a given period. When outflows exceed inflows, more Bitcoin is leaving exchanges and entering long-term storage - a sign of accumulation. When inflows exceed outflows, investors may be preparing to sell. The Diamond Pigs Sentiment Dashboard displays netflow as a weekly bar chart showing inflows vs. outflows side by side.
What is the BTC funding rate and why does it matter?
The BTC funding rate is a periodic payment exchanged between long and short traders in Bitcoin futures markets. A positive rate means long traders pay short traders, signalling that the market is leaning bullish. A very high positive rate can indicate overcrowded long positions, which often precede sharp corrections when sentiment shifts. The Diamond Pigs dashboard shows the current 8-hour rate, the annualised equivalent, and total open interest to give a full picture of derivatives positioning.
What is the crypto fear and greed index?
The crypto fear and greed index is a composite score that places current market sentiment on a scale from 0 (extreme fear) to 100 (extreme greed). It draws on inputs such as price volatility, trading volume, social media activity, and momentum data. Historically, extreme fear has corresponded with periods where assets were undervalued relative to longer-term trends, while extreme greed has often preceded corrections. The Diamond Pigs Sentiment Dashboard includes this as one of its seven modules.
What is global M2 and why does it affect Bitcoin?
Global M2 is a measure of the total money supply across major economies, including cash, bank deposits, and short-term savings. When central banks expand M2, more capital tends to flow into risk assets including crypto. Bitcoin has a historically strong correlation with global liquidity trends, as CF Benchmarks research shows. The Diamond Pigs dashboard tracks global M2, currently at $96.77 trillion, giving investors macro context alongside on-chain and sentiment signals.
What is Diamond Pigs' crypto sentiment dashboard?
Diamond Pigs is developing a Crypto Sentiment Dashboard that presents Bitcoin's key market drivers in a simple, structured daily format. It covers seven modules: BTC Price, Buying Power, BTC Netflow, BTC Funding Rate, Global Liquidity (M2), Crypto Market Sentiment, and VIX. The dashboard is designed for retail investors who want clear, institutional-grade insight without having to interpret raw data. Early access is free - details are in the Diamond Pigs April 2026 update.
Glossary
On-chain data - information recorded directly on a blockchain, such as wallet activity, transaction volumes, and coin movement patterns. It reflects real market behaviour rather than speculation or opinion.
BTC Netflow - the net difference between Bitcoin flowing into exchanges (inflows) and Bitcoin leaving exchanges to private wallets (outflows). Persistent outflows indicate accumulation; persistent inflows can signal selling pressure.
Funding rate - a periodic payment between long and short traders in crypto derivatives markets. A high positive funding rate signals crowded long positioning and can precede sharp corrections.
Buying Power - in the Diamond Pigs dashboard, the ratio of stablecoin supply to total crypto market cap. A higher ratio means more capital is available on the sidelines, ready to enter the market.
Fear and greed index - a composite sentiment score ranging from extreme fear (0) to extreme greed (100), used to gauge the overall mood of the crypto market at any given time.
Global M2 - a measure of the total global money supply. Rising M2 typically correlates with stronger performance of risk assets, including crypto.
VIX - the CBOE Volatility Index, which measures expected volatility in US equity markets. A rising VIX signals fear in broader markets and often correlates with crypto weakness.
Compressed volatility - a market condition in which increased automation leads to faster and sharper price moves, leaving less time for investors to react before a trend reverses.
Market regime - the prevailing macro and sentiment environment in financial markets, broadly categorised as bullish (expanding liquidity, positive sentiment) or bearish (contracting liquidity, fear-driven). Diamond Pigs uses regime analysis to guide strategy rotation and bot selection.
Related Posts

5 signs crypto investing emotions are costing you money

Bitcoin ETF outflows explained: what June 2026 really means

How long do crypto bear markets last? What history tells long-term investors
Never miss another article
Sign up to our email list to receive monthly newsletter.
